AI Data Analyst for Instant Data Insights
Connect your data, ask questions in plain English, and get instant insights in seconds.
Start your 14-day free trial — no credit card needed
AI Data Analysis Made Simple
Get Instant Data Insights
Simple conversations that turn into powerful insights in minutes.
Ask Data Questions in Natural Language
Like talking to a colleague
"What were our top performing products last month?" "Show me customer churn by region" - Just ask in plain English and watch the magic happen.
AI Generates Python Code Automatically
Python writes itself
Our AI reads your question, generates the right analysis code (pandas, matplotlib, statistical models), and executes it securely with your actual data.
Get Instant Data Insights & Visualizations
Charts & insights in real-time
Charts, tables, and actionable insights stream back instantly. Share with your team or dive deeper with follow-up questions.
What You Can
Do
Real questions, instant answers. See how Chat Analyst transforms natural language into verified Python code, charts, and actionable insights.
"NVIDIA Stock Analysis"
Comprehensive financial analysis with CAGR, volatility, drawdown, and performance metrics.
import pandas as pd
import numpy as np
import json

# Load data
df = pd.read_csv(DATASET_PATHS[0])

# Parse Date, remove timezone info
# Convert to UTC then drop tz
df['Date'] = pd.to_datetime(df['Date'], utc=True).dt.tz_convert('UTC').dt.tz_localize(None)
df.sort_values('Date', inplace=True)

# Daily returns
df['Return'] = df['Close'].pct_change()
daily_ret = df['Return'].dropna()

# Compute metrics
start_price = df['Close'].iloc[0]
end_price = df['Close'].iloc[-1]

# Duration in years
duration_years = (df['Date'].iloc[-1] - df['Date'].iloc[0]).days / 365.25

cagr = (end_price / start_price) ** (1 / duration_years) - 1
cumulative_return = end_price / start_price - 1
daily_vol = daily_ret.std()
annual_vol = daily_vol * np.sqrt(252)

# Max drawdown
dumax = df['Close'].cummax()
drawdown = df['Close'] / dumax - 1
max_dd = drawdown.min()
max_dd_date = df.loc[drawdown.idxmin(), 'Date'].strftime('%Y-%m-%d')

# 1-year return
one_year_ago = df['Date'].iloc[-1] - pd.Timedelta(days=365)
df_1y = df[df['Date'] >= one_year_ago]
return_1y = df_1y['Close'].iloc[-1] / df_1y['Close'].iloc[0] - 1 if not df_1y.empty else None

# Return since 2016
df_2016 = df[df['Date'] >= pd.Timestamp('2016-01-01')]
return_since_2016 = df_2016['Close'].iloc[-1] / df_2016['Close'].iloc[0] - 1 if not df_2016.empty else None

metrics = {
    'CAGR': cagr,
    'Annualized Volatility': annual_vol,
    'Cumulative Return': cumulative_return,
    'Max Drawdown': max_dd,
    'Max Drawdown Date': max_dd_date,
    '1Y Return': return_1y,
    'Return Since 2016': return_since_2016
}

# Output JSON
print(json.dumps(metrics, indent=2))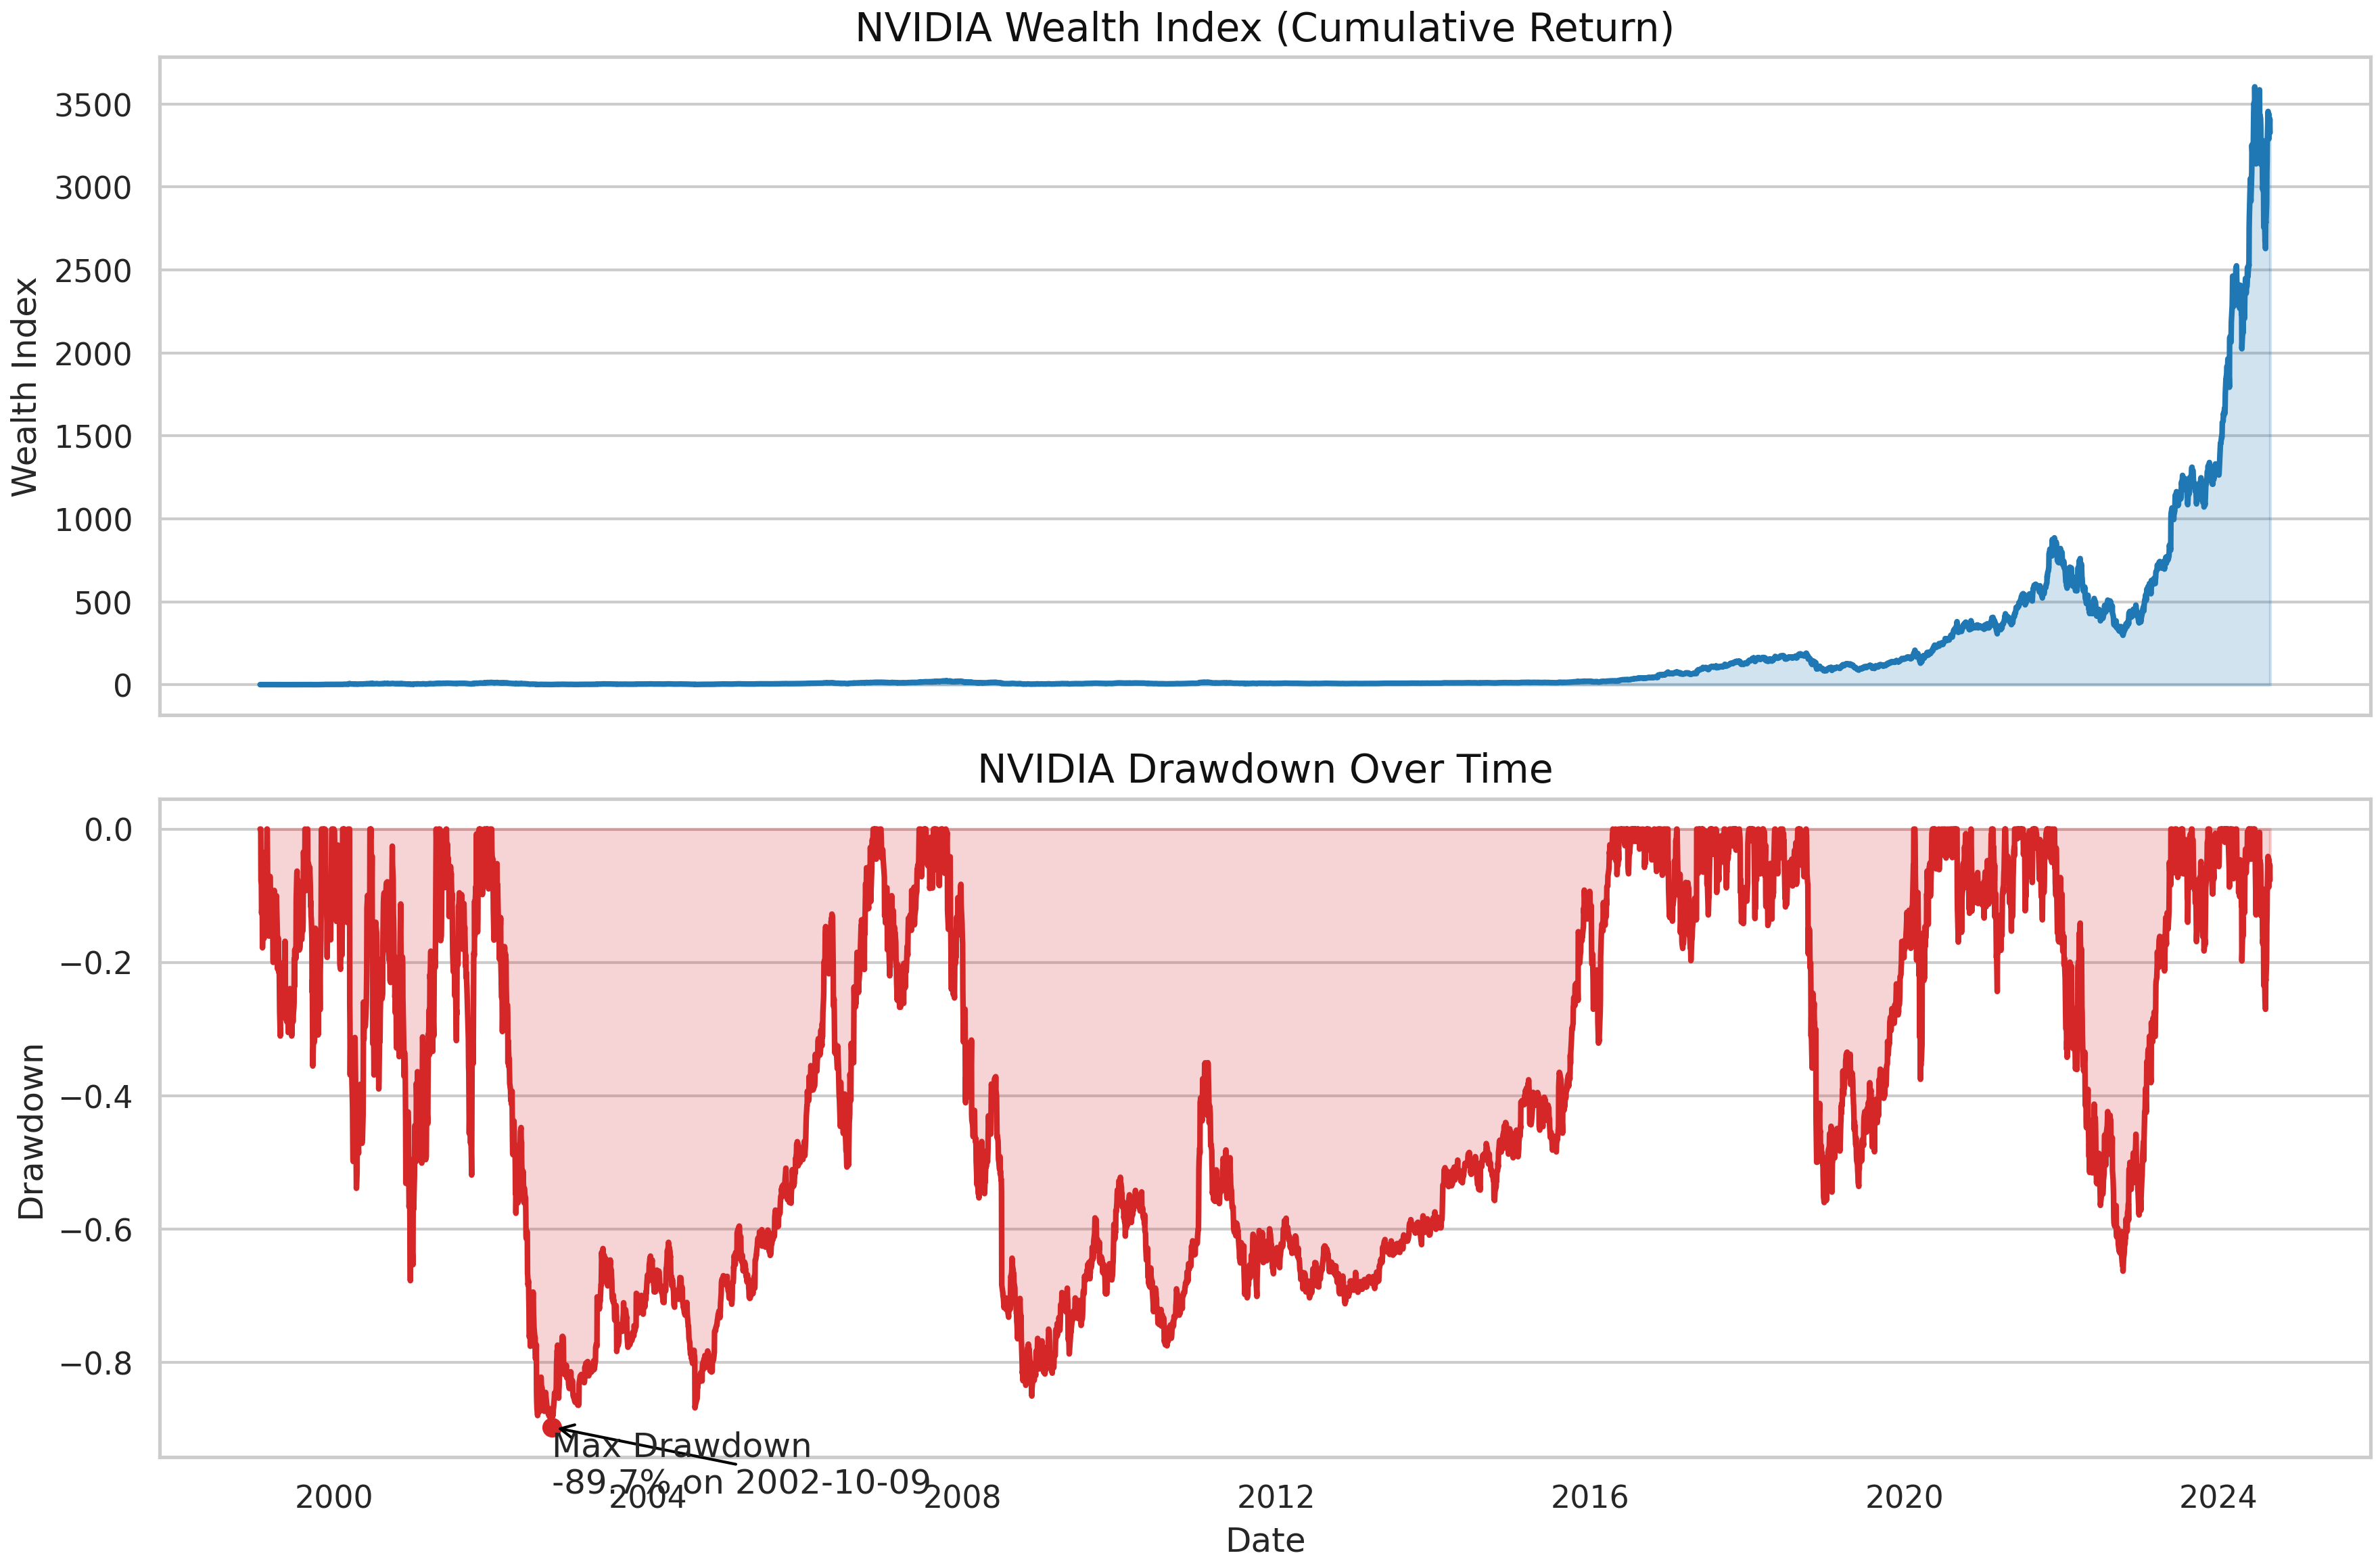
"Cohort Analysis for Customer Retention"
Analyze customer retention patterns across with cohort insights.
import pandas as pd
import matplotlib.pyplot as plt
import seaborn as sns

# Load and clean data
df = pd.read_csv(DATASET_PATHS[0], encoding='ISO-8859-1')
df = df[df['Quantity'] > 0].copy()
df['InvoiceDate'] = pd.to_datetime(df['InvoiceDate'], errors='coerce')
df = df.dropna(subset=['InvoiceDate', 'CustomerID'])

# Cohort analysis
df['CustomerID'] = df['CustomerID'].astype(int)
df['InvoiceMonth'] = df['InvoiceDate'].dt.to_period('M')
first_purchase = df.groupby('CustomerID')['InvoiceMonth'].min().reset_index()
first_purchase.columns = ['CustomerID', 'CohortMonth']

df = df.merge(first_purchase, on='CustomerID')
df['CohortIndex'] = ((df['InvoiceMonth'].dt.year - df['CohortMonth'].dt.year) * 12 +
                     (df['InvoiceMonth'].dt.month - df['CohortMonth'].dt.month) + 1)

# Calculate retention rates
cohort_data = df.groupby(['CohortMonth', 'CohortIndex'])['CustomerID'].nunique().reset_index()
cohort_counts = cohort_data.pivot(index='CohortMonth', columns='CohortIndex', values='CustomerID')
cohort_sizes = cohort_counts.iloc[:, 0]
retention = cohort_counts.divide(cohort_sizes, axis=0)

# Visualize
plt.figure(figsize=(12, 8))
sns.heatmap(retention, annot=True, fmt='.0%', cmap='Blues')
plt.title('Cohort Retention Rates')
plt.tight_layout()
plt.savefig('cohort_retention_heatmap.png')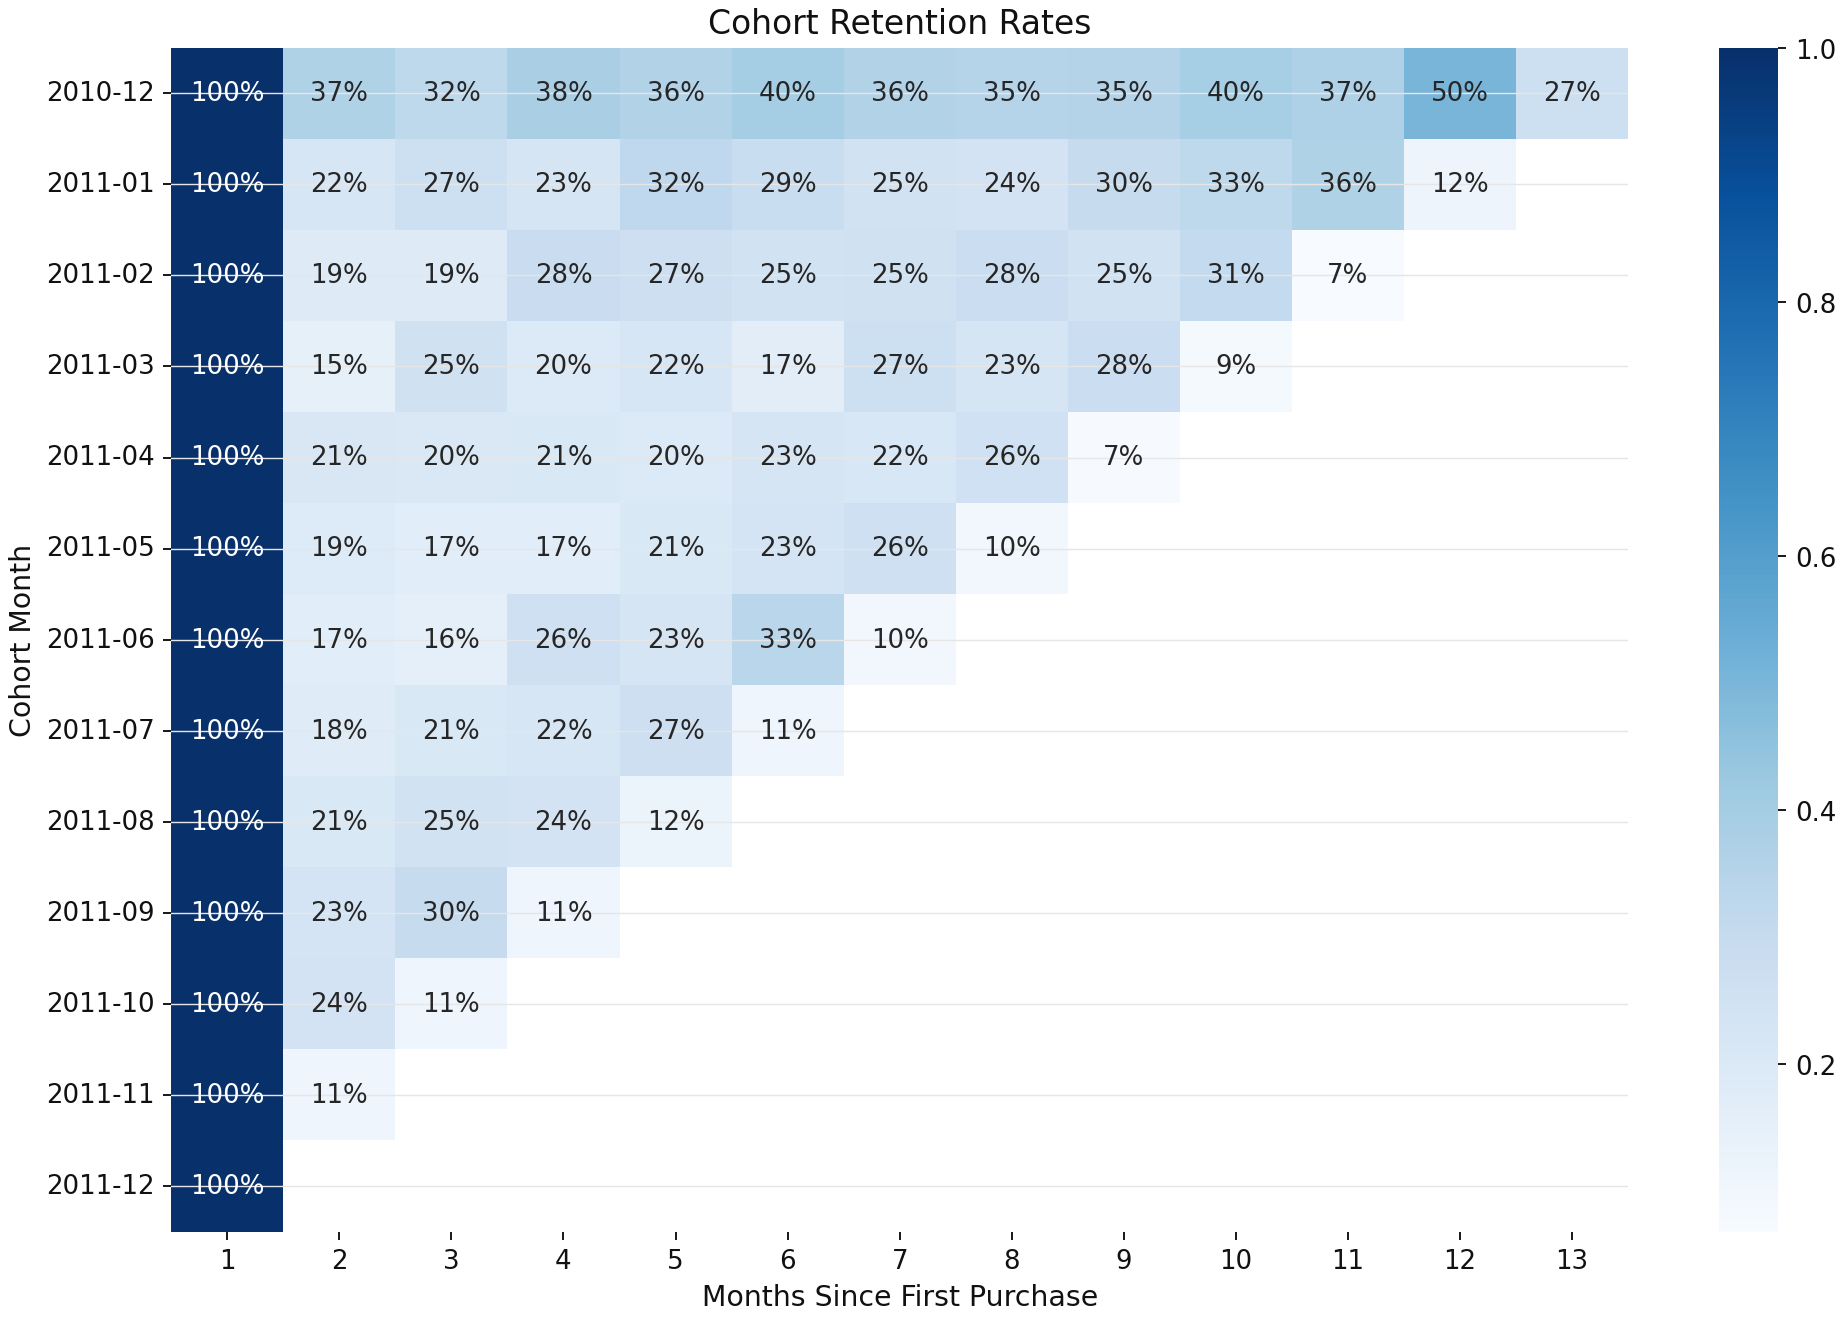
Core Features That
Power Your Analytics
Four essential capabilities that transform how you interact with data - from natural conversation to instant insights and beautiful visualizations.
Talk to Your Data Like a Human
Ask questions in plain English and get instant insights. No coding required, no complex queries - just natural conversation that turns into professional charts and Python analysis in seconds.
Connect to Any Database Instantly
One-click connections to PostgreSQL, Snowflake, BigQuery, Redshift, and more. No IT tickets, no waiting - your enterprise data is ready to analyze in minutes, not weeks.
Drag-and-Drop Dashboard Builder
Say "build me a sales dashboard" and watch as multiple charts appear instantly. Rearrange with drag-and-drop, resize on any screen, and share with your team immediately.
Upload Anything, Analyze Everything
Drop in Excel files, CSVs, or images and get instant analysis. Our AI automatically creates summaries, finds patterns, and suggests next steps - like having a data analyst review your files in seconds.
From connection to
insights in minutes
Three simple steps to transform your data into actionable insights. No technical expertise required - just describe what you want to see.
Connect
Simply enter your database credentials - host, username, password, and database name. Our secure system handles the rest.
Add Data Models
Tell our AI what data you want to analyze with natural language. Our AI generates SQL with business logic and joins automatically.
Ask Questions
Now you can ask questions in plain English and get instant insights with beautiful visualizations.
Connect Your
Business Data
Link your databases, warehouses, and cloud storage in seconds —no IT tickets required. Get instant insights from your live data.
Frequently Asked
Questions
Everything you need to know about security, data access, and accuracy.
Your data never leaves your infrastructure. We use production-grade security with RBAC and audit trails. Data tokens are short-lived and server-side only.
We support 50+ connectors including Snowflake, BigQuery, Postgres, Redshift, MySQL, and popular SaaS platforms. You bring your own credentials - we never store or move your data.
Our AI generates Python code with full verification and explainability. You can review all code before execution, and we provide audit trails for every analysis. The Python sandbox runs in a secure, isolated environment.
Plus includes core chat analysis, Pro adds dashboard building and advanced features, Enterprise includes RBAC and dedicated support. All plans include unlimited queries and data connectors.
Enterprise customers can deploy on AWS with separate infrastructure for enhanced security. We provide dedicated databases and isolated environments with full feature parity.
Our secure Python environment runs in isolated containers with access to popular data science libraries. Code execution is sandboxed and monitored, with no network access to external resources.
Plus and Pro plans include email support and documentation. Enterprise includes dedicated customer success, priority support, training sessions, and custom integrations.
Ready to turn your data into decisions?
Join hundreds of teams already making smarter decisions with AI-powered analytics
No credit card required • 14-day free trial