Chat with Your Data for Instant Analysis
Your AI-powered data analyst that codes, visualizes, and delivers insights in seconds.
Start your 14-day free trial — no credit card needed
What You Can
Do
Real questions, instant answers. See how Chat Analyst transforms natural language into verified Python code, charts, and actionable insights.
"NVIDIA Stock Analysis"
Comprehensive financial analysis with CAGR, volatility, drawdown, and performance metrics.
import pandas as pd
import numpy as np
import json

# Load data
df = pd.read_csv(DATASET_PATHS[0])

# Parse Date, remove timezone info
# Convert to UTC then drop tz
df['Date'] = pd.to_datetime(df['Date'], utc=True).dt.tz_convert('UTC').dt.tz_localize(None)
df.sort_values('Date', inplace=True)

# Daily returns
df['Return'] = df['Close'].pct_change()
daily_ret = df['Return'].dropna()

# Compute metrics
start_price = df['Close'].iloc[0]
end_price = df['Close'].iloc[-1]

# Duration in years
duration_years = (df['Date'].iloc[-1] - df['Date'].iloc[0]).days / 365.25

cagr = (end_price / start_price) ** (1 / duration_years) - 1
cumulative_return = end_price / start_price - 1
daily_vol = daily_ret.std()
annual_vol = daily_vol * np.sqrt(252)

# Max drawdown
dumax = df['Close'].cummax()
drawdown = df['Close'] / dumax - 1
max_dd = drawdown.min()
max_dd_date = df.loc[drawdown.idxmin(), 'Date'].strftime('%Y-%m-%d')

# 1-year return
one_year_ago = df['Date'].iloc[-1] - pd.Timedelta(days=365)
df_1y = df[df['Date'] >= one_year_ago]
return_1y = df_1y['Close'].iloc[-1] / df_1y['Close'].iloc[0] - 1 if not df_1y.empty else None

# Return since 2016
df_2016 = df[df['Date'] >= pd.Timestamp('2016-01-01')]
return_since_2016 = df_2016['Close'].iloc[-1] / df_2016['Close'].iloc[0] - 1 if not df_2016.empty else None

metrics = {
    'CAGR': cagr,
    'Annualized Volatility': annual_vol,
    'Cumulative Return': cumulative_return,
    'Max Drawdown': max_dd,
    'Max Drawdown Date': max_dd_date,
    '1Y Return': return_1y,
    'Return Since 2016': return_since_2016
}

# Output JSON
print(json.dumps(metrics, indent=2))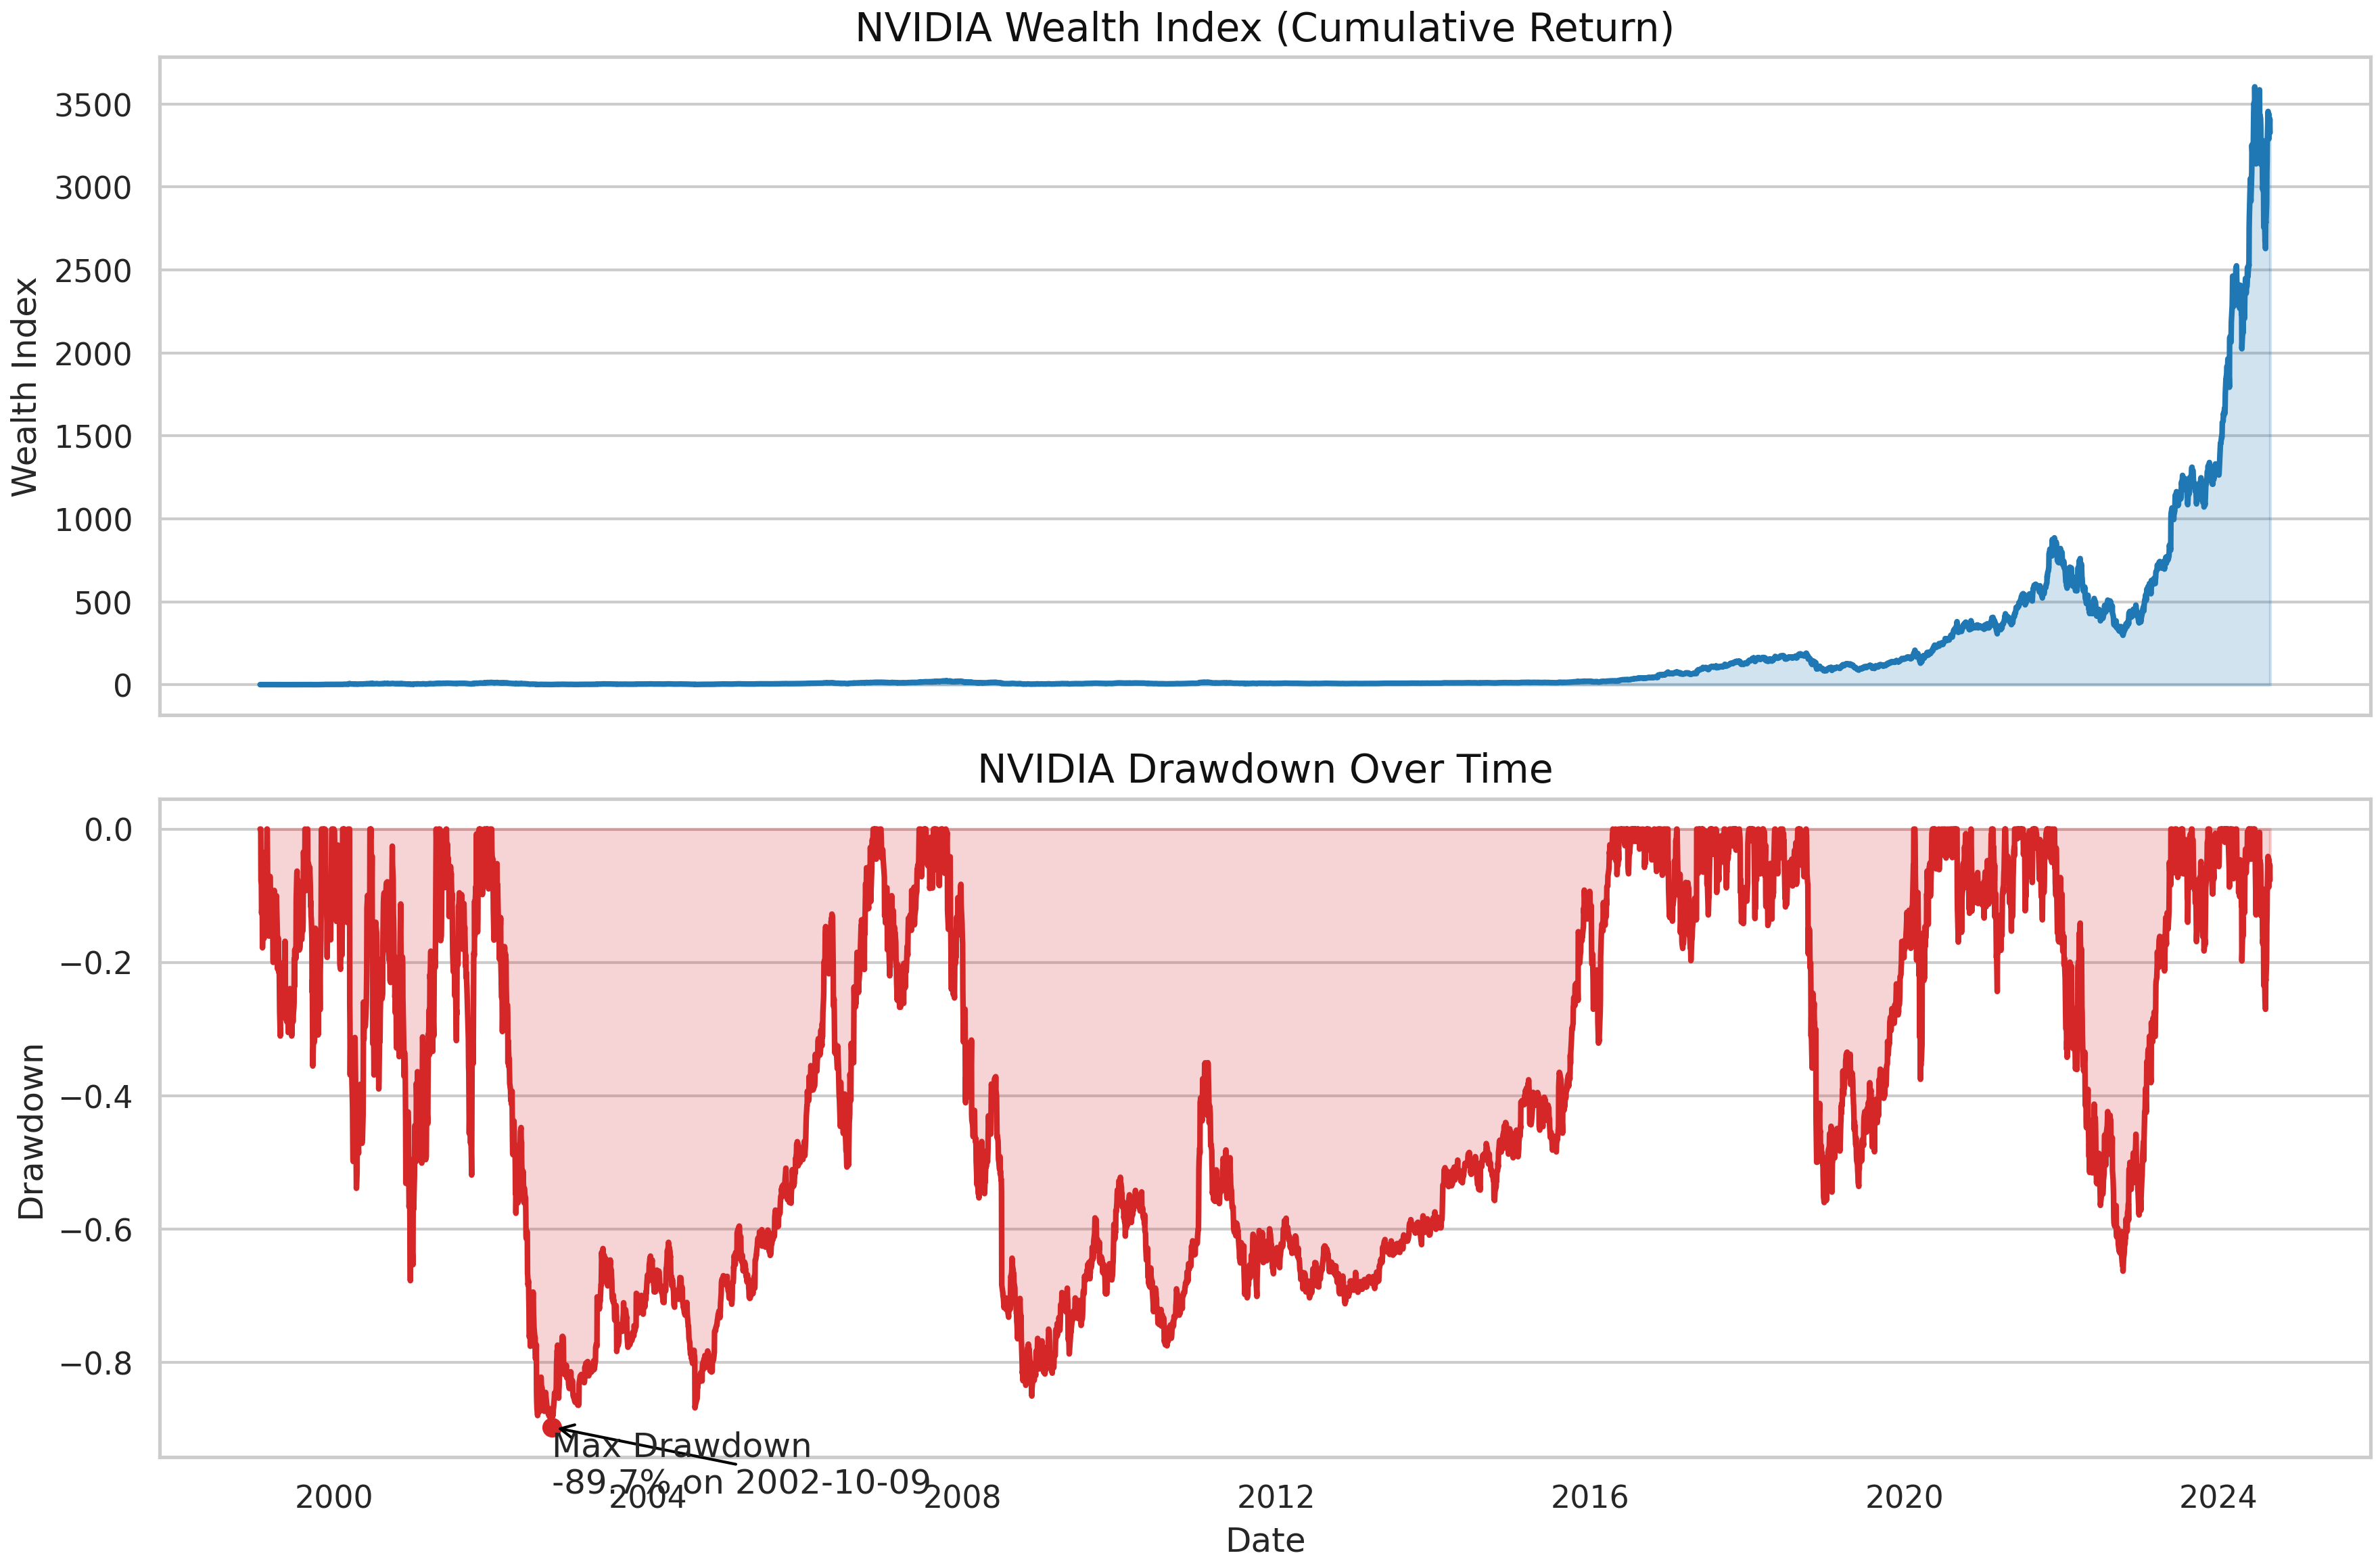
"Cohort Analysis for Customer Retention"
Analyze customer retention patterns across with cohort insights.
import pandas as pd
import matplotlib.pyplot as plt
import seaborn as sns

# Load and clean data
df = pd.read_csv(DATASET_PATHS[0], encoding='ISO-8859-1')
df = df[df['Quantity'] > 0].copy()
df['InvoiceDate'] = pd.to_datetime(df['InvoiceDate'], errors='coerce')
df = df.dropna(subset=['InvoiceDate', 'CustomerID'])

# Cohort analysis
df['CustomerID'] = df['CustomerID'].astype(int)
df['InvoiceMonth'] = df['InvoiceDate'].dt.to_period('M')
first_purchase = df.groupby('CustomerID')['InvoiceMonth'].min().reset_index()
first_purchase.columns = ['CustomerID', 'CohortMonth']

df = df.merge(first_purchase, on='CustomerID')
df['CohortIndex'] = ((df['InvoiceMonth'].dt.year - df['CohortMonth'].dt.year) * 12 +
                     (df['InvoiceMonth'].dt.month - df['CohortMonth'].dt.month) + 1)

# Calculate retention rates
cohort_data = df.groupby(['CohortMonth', 'CohortIndex'])['CustomerID'].nunique().reset_index()
cohort_counts = cohort_data.pivot(index='CohortMonth', columns='CohortIndex', values='CustomerID')
cohort_sizes = cohort_counts.iloc[:, 0]
retention = cohort_counts.divide(cohort_sizes, axis=0)

# Visualize
plt.figure(figsize=(12, 8))
sns.heatmap(retention, annot=True, fmt='.0%', cmap='Blues')
plt.title('Cohort Retention Rates')
plt.tight_layout()
plt.savefig('cohort_retention_heatmap.png')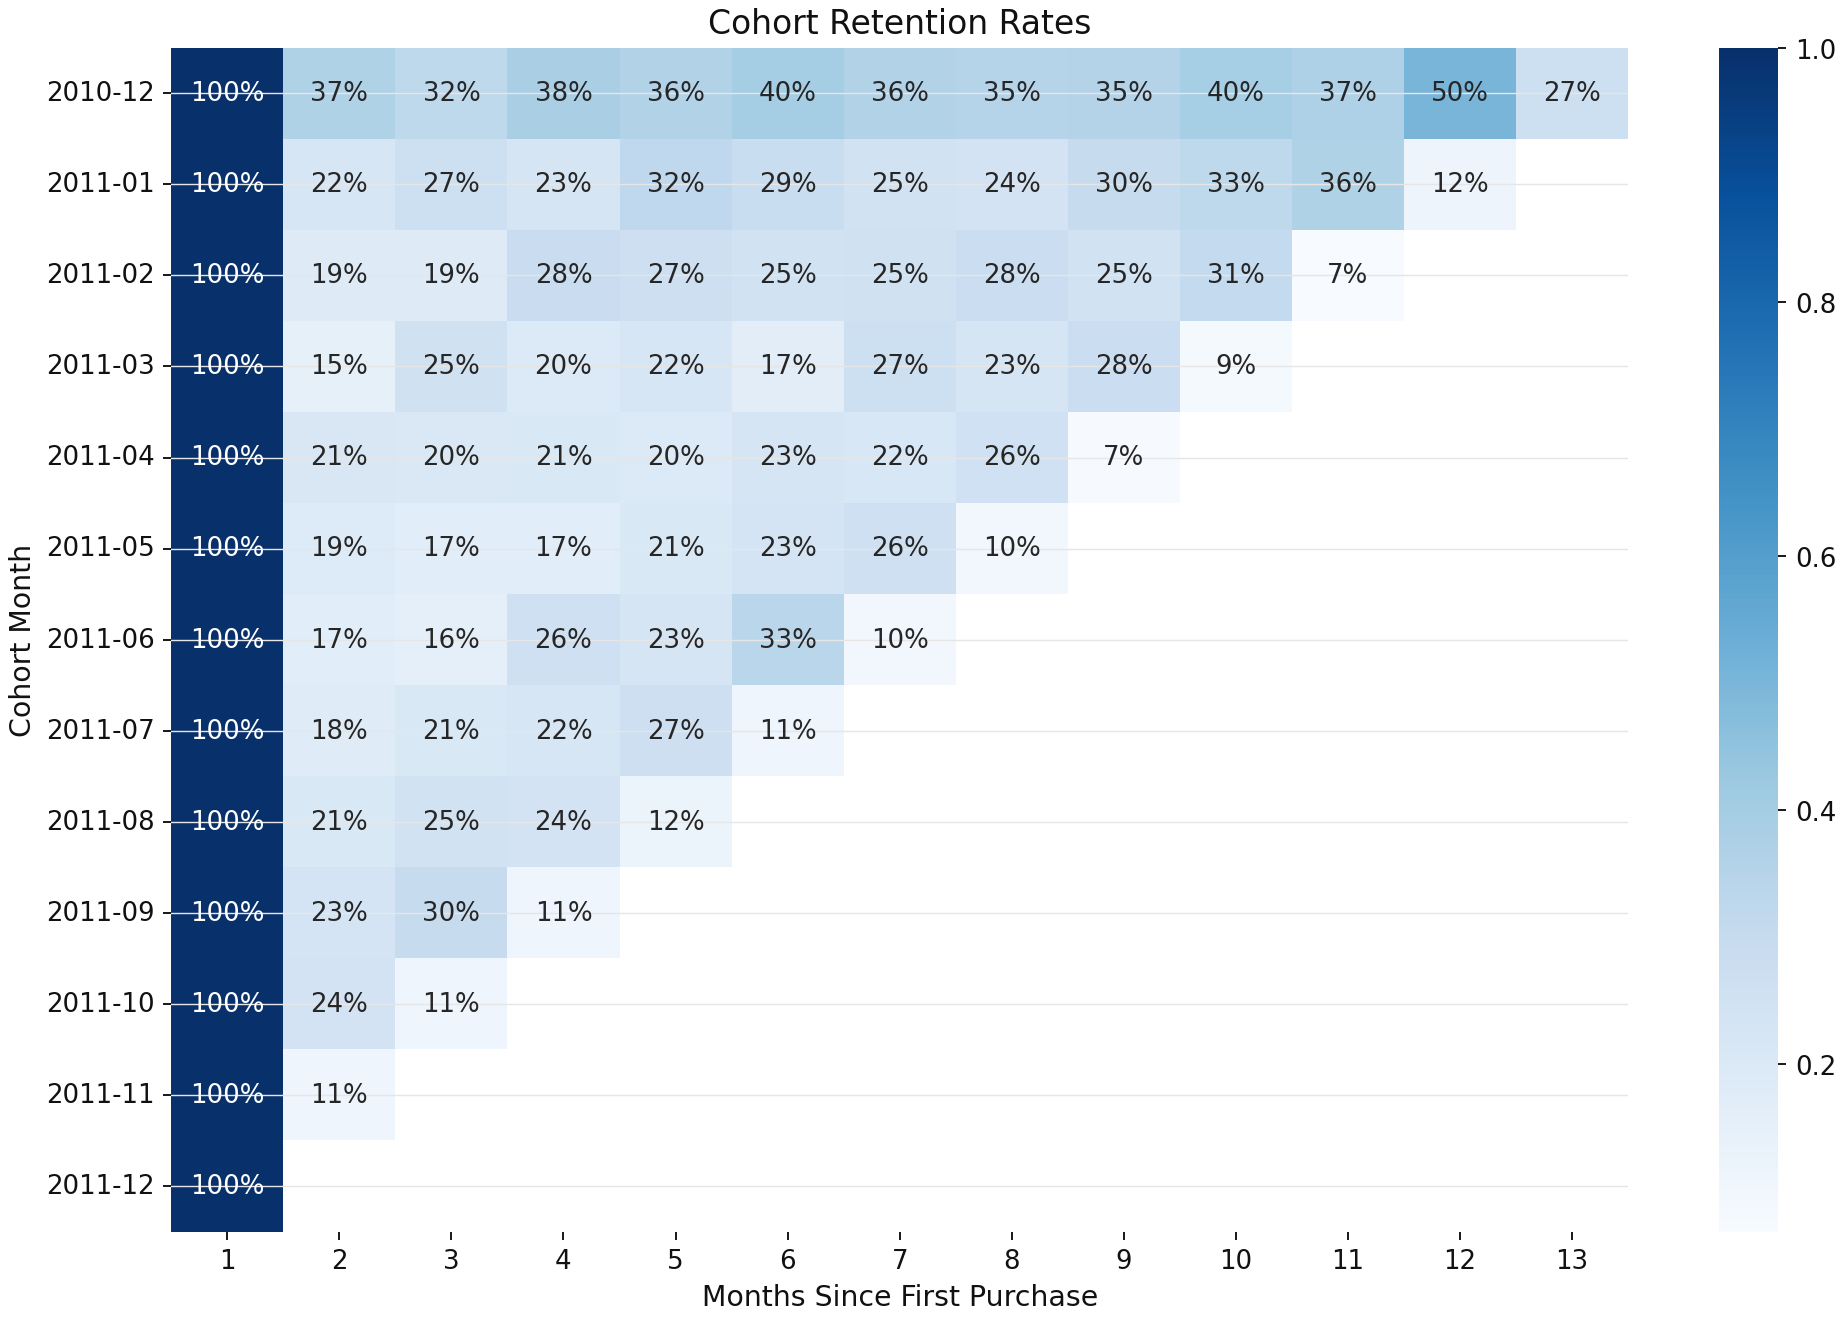
Key
Capabilities
Powerful features that transform how you interact with data - from natural language queries to automated insights and secure sharing.
Natural Language → Python
With Code Generation & Execution
Transform questions into Python data analysis code with full transparency. Every script is explainable, auditable, and executed in a secure sandbox.
Autogenerated Charts
Plus Narrative Insights
Get instant visualizations with AI-powered narrative insights that explain patterns, trends, and anomalies in your data automatically.
File Attachments
CSVs, Docs & Live Data
Upload CSV files, attach documents, or connect to live data sources via connectors and models for comprehensive analysis.
Connect Data Sources
Enterprise-Grade Data Integration
Connect to 50+ data sources with enterprise security. Direct access to live data without movement or storage - analyze your entire data stack in real-time.
Chart Ask
On Saved Dashboards
Ask questions about any chart on your saved dashboards with FloatingChat and per-chart ChartAskModal for deeper insights.
Export Everything
Python, Tables & Images
Copy generated Python code, export tables to CSV, save charts as images, and share results with your team seamlessly.
Safety &
Governance
Production-grade security with complete transparency. Your data stays secure while you get the insights you need.
Python Sandbox Security
Code runs in isolated containers with no network access to external resources, ensuring complete security isolation.
Dataset Token Management
Short-lived, server-side tokens with automatic expiration and permission-based access control.
Complete Audit Trails
Every query, execution, and result is logged with full traceability and compliance reporting.
RBAC & User Management
Enterprise authentication with role-based access control and user management capabilities.
Frequently Asked
Questions
Everything you need to know about Chat Analyst's accuracy, data access, model providers, and security.
Our AI achieves 98%+ accuracy on Python code generation with built-in verification. Every script is explainable and can be reviewed before execution. We use advanced prompt engineering and model fine-tuning specifically for Python data analysis.
Chat Analyst supports 50+ connectors including Snowflake, BigQuery, Postgres, Redshift, MySQL, and popular SaaS platforms. You bring your own credentials - we never store or move your data outside your environment.
We currently support OpenAI (GPT-4, GPT-3.5) with other providers like Anthropic (Claude), Google (Gemini), and Azure OpenAI coming soon. You'll be able to switch between providers and models based on your needs and compliance requirements.
Python code runs in completely isolated containers with no network access to external resources. Each execution is sandboxed, monitored, and automatically cleaned up. Resource limits prevent abuse and ensure system stability.
No, we never store your actual data. Query results are temporarily cached for the session only. All dataset tokens are short-lived and server-side. Signed URLs are stripped before any persistence for security.
Enterprise customers can deploy on AWS with separate infrastructure for enhanced security. We provide dedicated databases and isolated environments with full feature parity and dedicated support.
Chart Ask uses FloatingChat and per-chart ChartAskModal components to let you ask questions about specific visualizations. The AI understands the chart context and can provide insights, suggest filters, or create related analyses.
Plus and Pro both include the same core features, but Plus has chat limits and limited connectors. Pro removes these restrictions and adds team collaboration. Enterprise includes RBAC, audit trails, dedicated support, and on-premises deployment options.
Ready to Transform
Questions into Insights?
Join hundreds of analysts already using Chat Analyst to get Python analysis, charts, and insights in seconds.